Question 2
Spend sufficient time observing the data presented in this table. Share your findings with the class.
These are some prompts for you to probe —
- Changes in the heights of boys or girls of a certain age from 1989 to 2019.
- The heights of boys vs. girls at different ages in a particular year.
- Changes in height between successive ages in boys and girls in 2019.
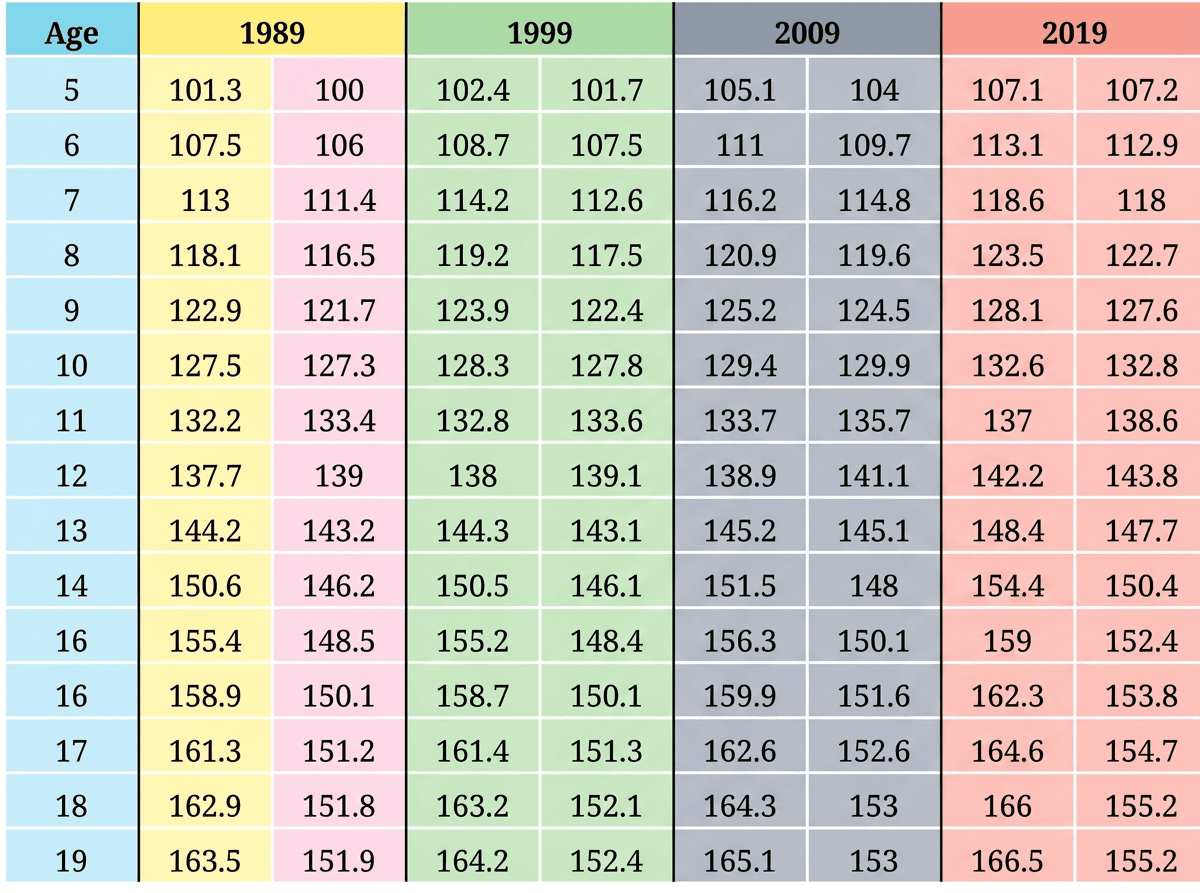
- The provided table records average heights of boys and girls from ages to across two different years ( and ).
- To explore the data:
- Trend over time: Compare heights at the same age between and .
- Gender comparison: Compare boys' vs. girls' heights across various ages in a given year.
- Yearly growth: Find the difference in height between consecutive ages to observe when growth spurts occur.
(i) Changes in the heights of boys or girls of a certain age from 1989 to 2019.
Step 1 · Calculate Height Changes from 1989 to 2019 at Age 10
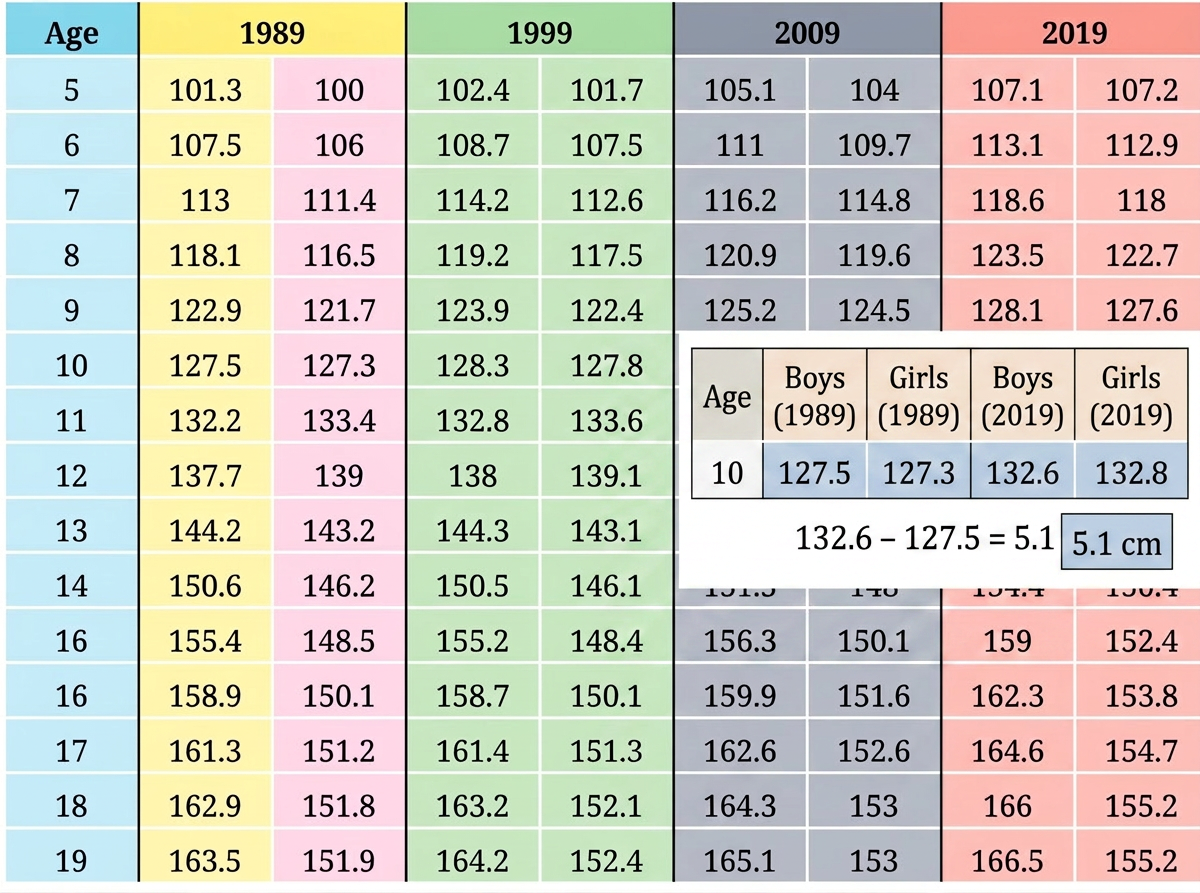
For 10-year-old boys:
- Height in 1989
- Height in 2019
For 10-year-old girls:
- Height in 1989
- Height in 2019
Both boys and girls grew taller over the 30-year period.
(i) Heights generally increased from 1989 to 2019 (e.g., at age 10, boys increased by and girls by ).
(ii) The heights of boys vs. girls at different ages in a particular year.
Step 1 · Compare Boys' and Girls' Heights in 2019
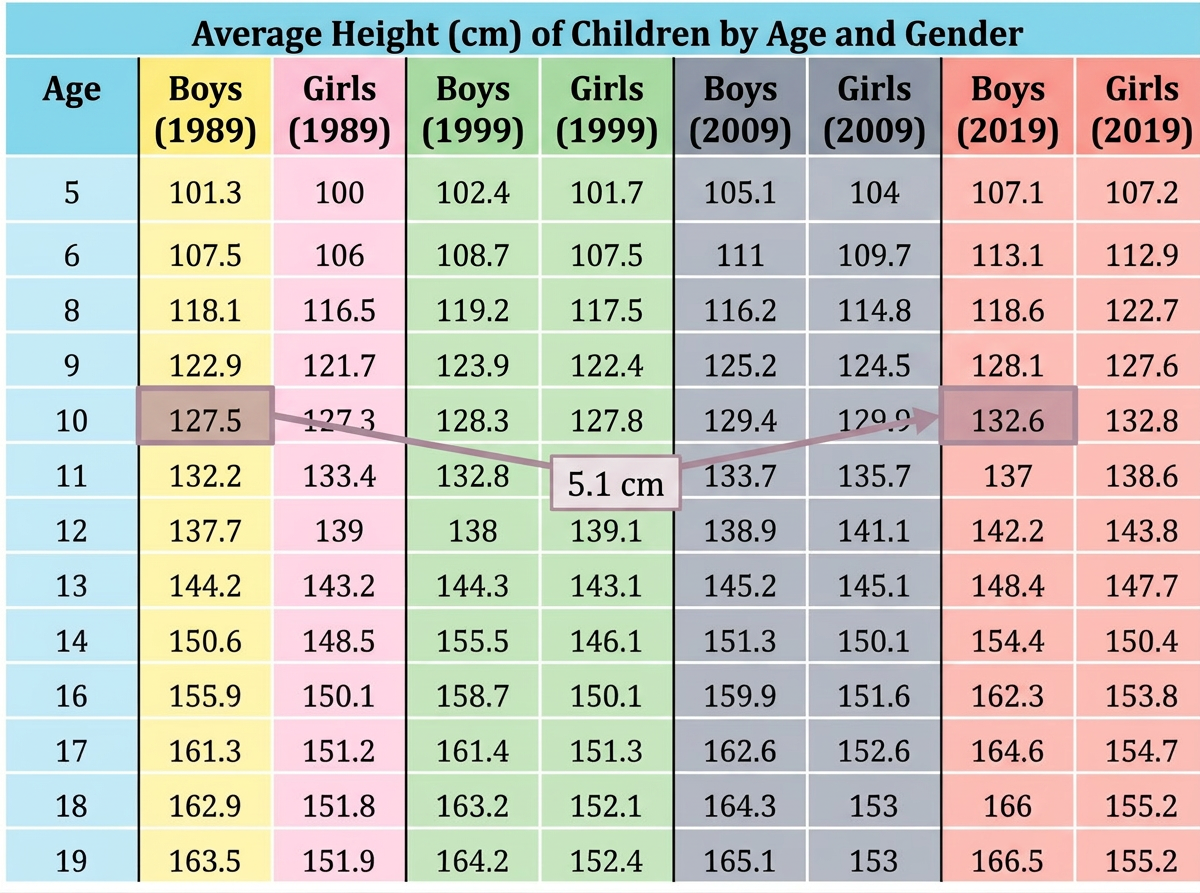
Comparing heights at different ages in 2019:
-
At age 5: Boys , Girls
-
At age 12: Boys , Girls
-
At age 14: Boys , Girls
-
At age 18: Boys , Girls
Girls are slightly taller at earlier ages (ages 5–12), while boys overtake girls from age 13 onwards.
(ii) In 2019, girls were slightly taller at younger ages (5–12), but boys overtook them around age 13 and became significantly taller by age 18 ( difference).
(iii) Changes in height between successive ages in boys and girls in 2019.
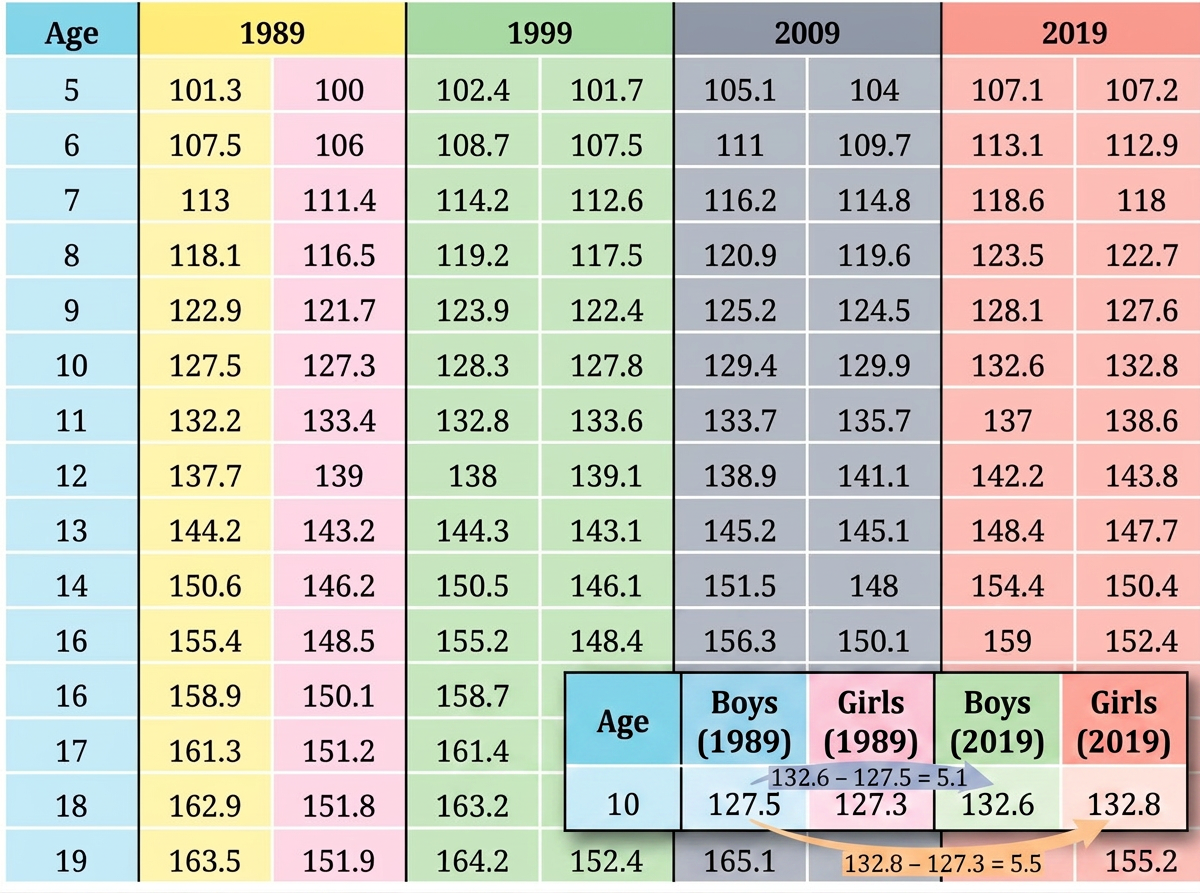
Step 1 · Calculate Yearly Growth between Successive Ages in 2019
-
Peak growth for boys (from age 12 to 13):
-
Peak growth for girls (from age 10 to 11):
-
Growth at older ages (from age 18 to 19):
- Boys:
- Girls:
Growth is fastest during early adolescence (puberty) and slows down significantly after age 17.
(iii) In 2019, boys experienced their biggest yearly growth around ages 12–13 (), whereas girls peaked earlier around ages 10–11 (). Growth slows down drastically after age 17.
- Column Confusion: Mixing up columns between and or between boys and girls when subtracting values.
- Misidentifying the Growth Spurt: Looking only at total height rather than the difference between successive ages to locate the peak growth spurt.
More questions in A
How long is a minute?
Two groups of children were asked to estimate the length of 1 minute. They start by closing their eyes and then open them when they think 1 minute has passed. Of course, they are not supposed to count while their eyes are closed. The dot plots below show after how many seconds the children opened their eyes.
Discuss how well both the groups fared at this activity. Describe and compare the variability in data and their central tendency.
Spend sufficient time observing the data presented in this table. Share your findings with the class.
These are some prompts for you to probe —
- Changes in the heights of boys or girls of a certain age from 1989 to 2019.
- The heights of boys vs. girls at different ages in a particular year.
- Changes in height between successive ages in boys and girls in 2019.
Connect the Dots...
A number lock has a 3-digit code. Find the code using the hints below.