Question 1
How long is a minute?
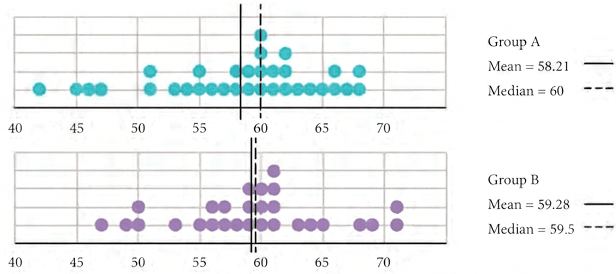
Two groups of children were asked to estimate the length of 1 minute. They start by closing their eyes and then open them when they think 1 minute has passed. Of course, they are not supposed to count while their eyes are closed. The dot plots below show after how many seconds the children opened their eyes.
Discuss how well both the groups fared at this activity. Describe and compare the variability in data and their central tendency.
- The actual length of is .
- Central Tendency (Mean and Median): Indicates how close the average and middle estimates are to .
- Variability (Range and Spread): Indicates how scattered or consistent the estimates are:
Step 1 · Analyze Group A's Estimates
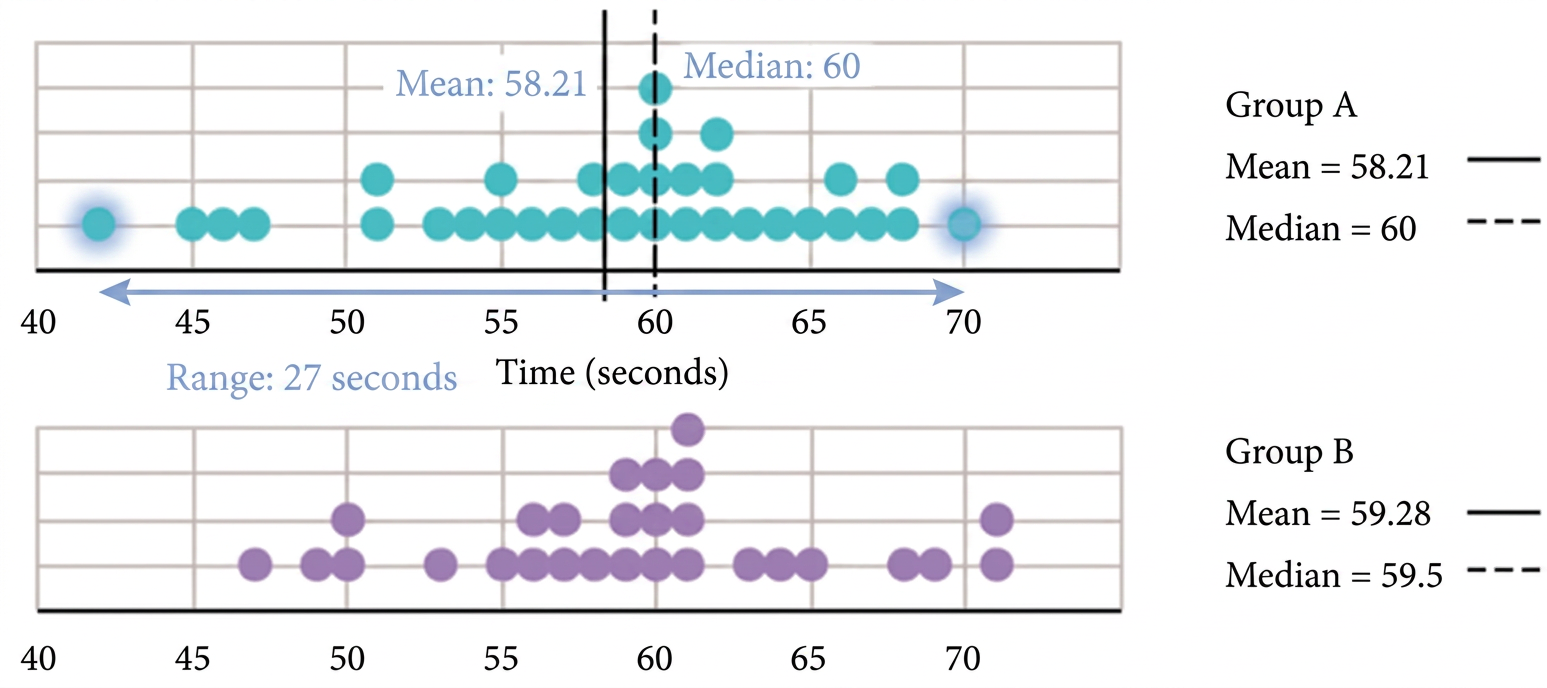
From the dot plot for Group A:
Step 2 · Analyze Group B's Estimates
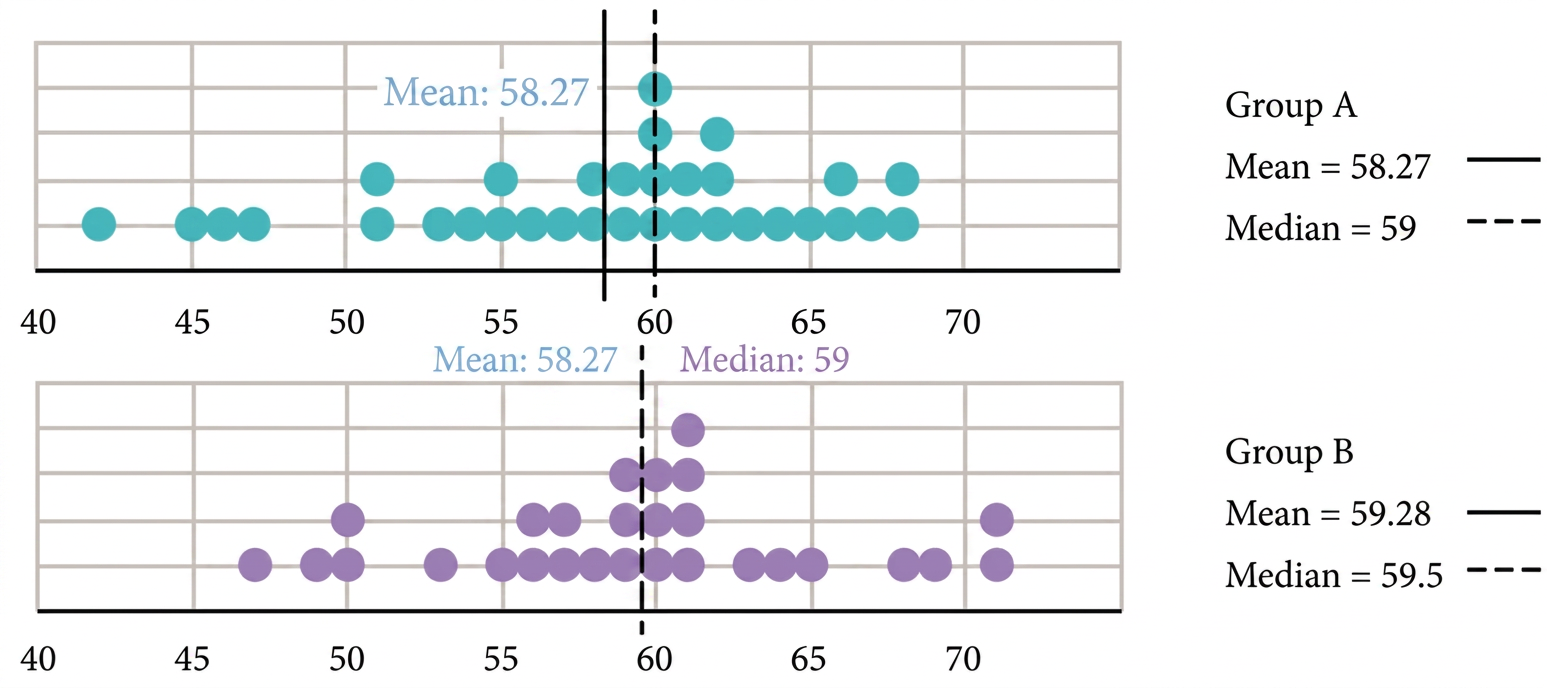
From the dot plot for Group B:
Step 3 · Compare Central Tendency and Variability
1. Central Tendency:
- Group A has a median of exactly , while Group B has a mean of and a median of .
- Both groups showed high accuracy as their central values are extremely close to .
2. Variability:
- Group A has a range of , and Group B has a range of .
- Although both ranges are very similar, Group B's estimates are more tightly clustered around , indicating slightly greater consistency.
Both groups estimated accurately on average. Group A achieved an exact median of , while Group B had a mean of and median of . In terms of variability, both had similar ranges ( for Group A and for Group B), but Group B was slightly more consistent due to tighter clustering around .
- Overlooking Data Clustering: Assuming two data sets have the same spread merely because their ranges are nearly equal ( vs. ), without checking how tightly points cluster around the center.
- Single Measure Bias: Evaluating performance using only the mean or only the median instead of comparing both measures of central tendency.
More questions in A
How long is a minute?
Two groups of children were asked to estimate the length of 1 minute. They start by closing their eyes and then open them when they think 1 minute has passed. Of course, they are not supposed to count while their eyes are closed. The dot plots below show after how many seconds the children opened their eyes.
Discuss how well both the groups fared at this activity. Describe and compare the variability in data and their central tendency.
Spend sufficient time observing the data presented in this table. Share your findings with the class.
These are some prompts for you to probe —
- Changes in the heights of boys or girls of a certain age from 1989 to 2019.
- The heights of boys vs. girls at different ages in a particular year.
- Changes in height between successive ages in boys and girls in 2019.
Connect the Dots...
A number lock has a 3-digit code. Find the code using the hints below.