Question 1
A teacher mixes a large bag of sweets of different colours and randomly selects a sample of 30 sweets. She counts the number of sweets of each colour: 10 red sweets | 8 green sweets | 7 yellow sweets | 5 blue sweets
(i) Calculate the probability that a randomly picked sweet from the sample is green.
(ii) If there are 600 sweets in total in the large bag, estimate how many are likely to be yellow, based on the sample results.
- The total number of sweets in the sample is .
- The probability of an outcome is calculated using the formula:
- To estimate the expected number of a specific item in a larger population, multiply the sample probability by the total population size ().
(i) Calculate the probability that a randomly picked sweet from the sample is green.
Step 1 · Calculate the Probability of Picking a Green Sweet
Total number of sweets in the sample
Number of green sweets 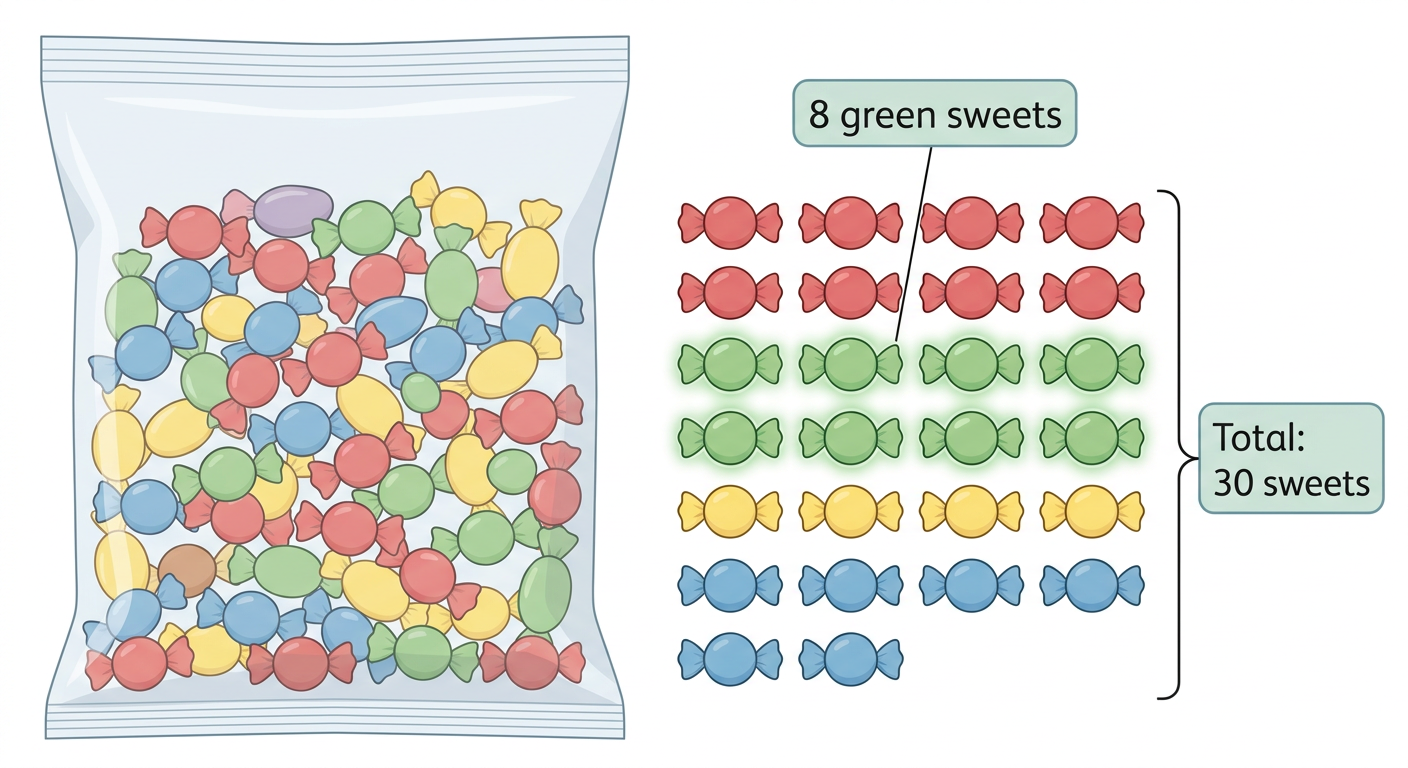
(i)
(ii) If there are 600 sweets in total in the large bag, estimate how many are likely to be yellow, based on the sample results.
Step 1 · Estimate the Number of Yellow Sweets
First, find the probability of picking a yellow sweet from the sample:
Now, estimate the total number of yellow sweets in the bag of sweets:
(ii)
- Not Simplifying the Fraction: Leaving unsimplified instead of reducing it to lowest terms ().
- Using the Wrong Denominator: Dividing by the total population size () instead of the sample size () when finding the sample probability.
More questions in Exercise 7.2
A teacher mixes a large bag of sweets of different colours and randomly selects a sample of 30 sweets. She counts the number of sweets of each colour: 10 red sweets | 8 green sweets | 7 yellow sweets | 5 blue sweets
(i) Calculate the probability that a randomly picked sweet from the sample is green.
(ii) If there are 600 sweets in total in the large bag, estimate how many are likely to be yellow, based on the sample results.
A survey is conducted at a school where a random sample of 40 students is asked about their favourite club. The responses are are: 14 students: Science Club | 11 students: Arts Club | 9 students: Sports Club | 6 students: Debate Club Assume there are 800 students in the whole school.
(i) What is the probability that a randomly chosen student from the sample prefers the Arts Club?
(ii) Using the sample results, estimate how many students in the whole school are likely to prefer the Sports Club.
Toss a coin 20 times and record the result each time (heads or tails).
(i) How many times did you get heads?
(ii) How many times did you get tails?
(iii) Calculate the experimental probability of getting heads.
(iv) If you toss the coin once more, what is the probability of getting tails?
Toss a paper cup into the air 100 times. After each toss record whether the cup lands on its bottom, upside down on its top or on its side (See Fig. 7.5). Assign probabilities to the outcomes by using experimental probability.
What is the probability of getting an even number when rolling a fair 6-sided die?
Suppose you roll a 6-sided die 12 times and get a '3' three times.
(i) What is the experimental probability of rolling a '3'?
(ii) What is the theoretical probability of rolling a '3'?
(iii) Why might these probabilities be different? What would you expect to happen if you roll the die 60, 600, or 6000 times?