Question 4
Pari wants to respond to the questions given below. Put a tick (✓) for the questions where she needs to carry out data collection and put a cross (✗) for the questions where she doesn’t need to collect data. Discuss your answers in the classroom.
a. What is the most popular TV show among her classmates? b. When did India get independence? c. How much water is getting wasted in her locality? d. What is the capital of India?
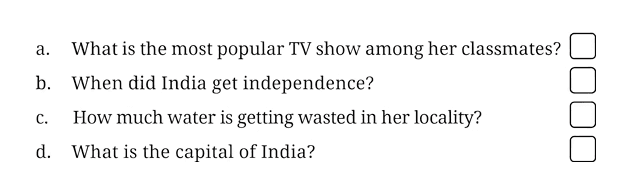
- Data collection is necessary when information is not already recorded or fixed and must be gathered firsthand through questions, surveys, measurements, or observations.
- Established, well-known facts (such as historical dates or capital cities) can be looked up directly and do not require data collection.
a. What is the most popular TV show among her classmates?
Step 1 · Analyze TV show question
To find out her classmates' preferences, Pari must ask them and record their answers.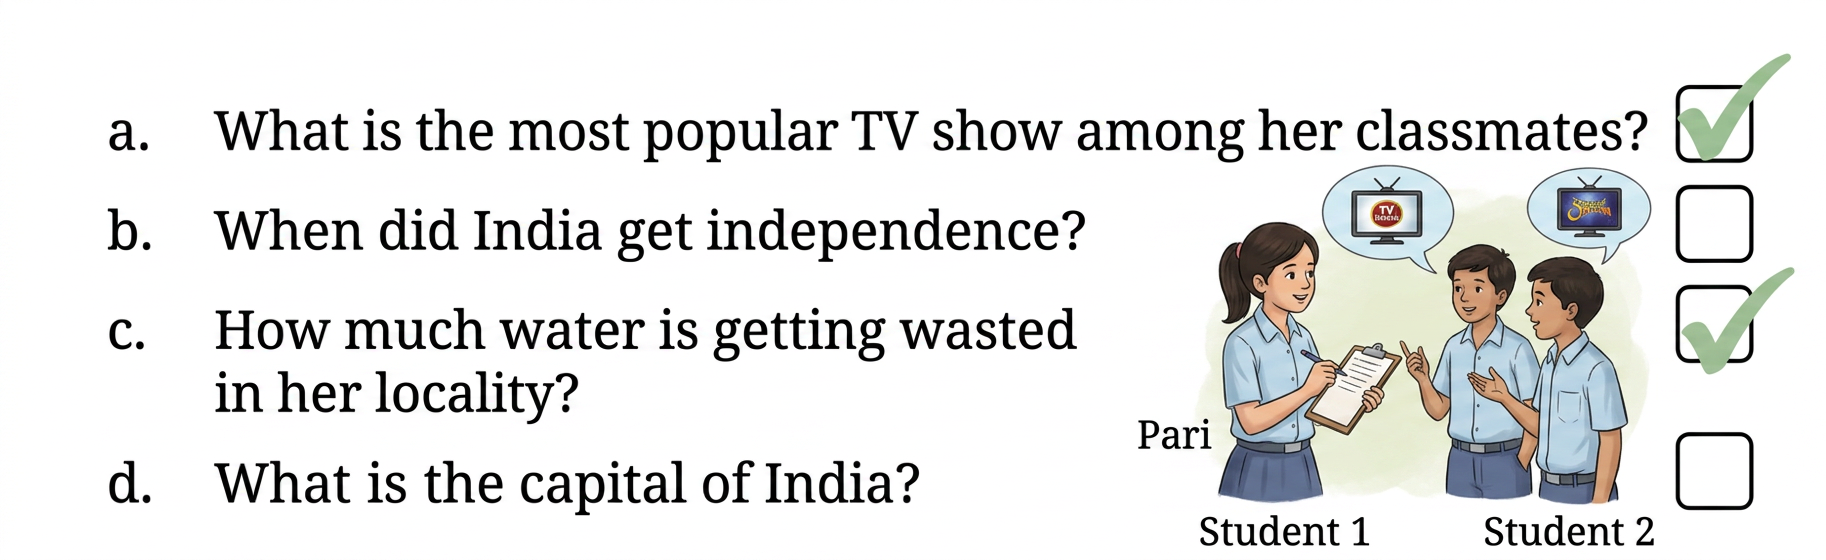
a. ✓ (Tick)
b. When did India get independence?
Step 1 · Analyze independence date question
The date of India's independence is an established historical fact ( August ) that can be looked up directly in books without collecting new data.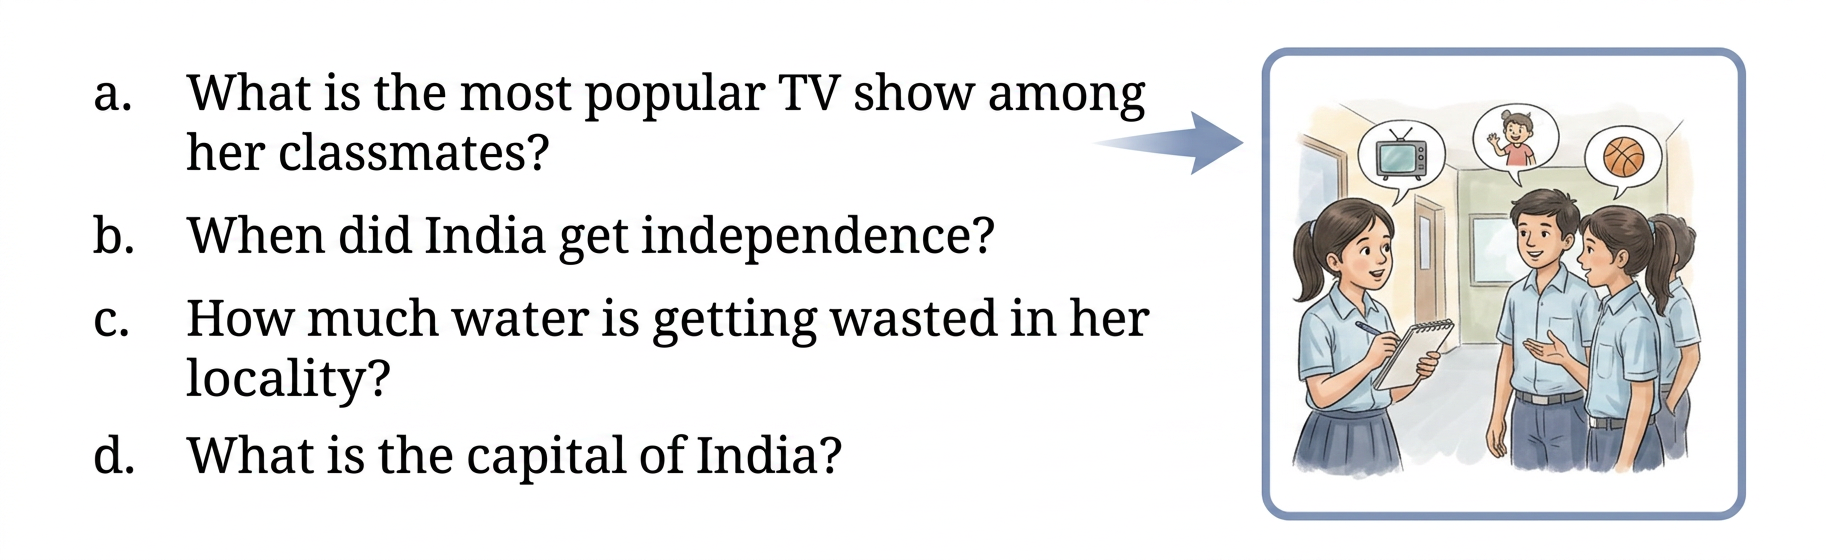
b. ✗ (Cross)
c. How much water is getting wasted in her locality?
Step 1 · Analyze water wastage question
To determine the quantity of water wasted, Pari must observe, survey, or take measurements in her locality.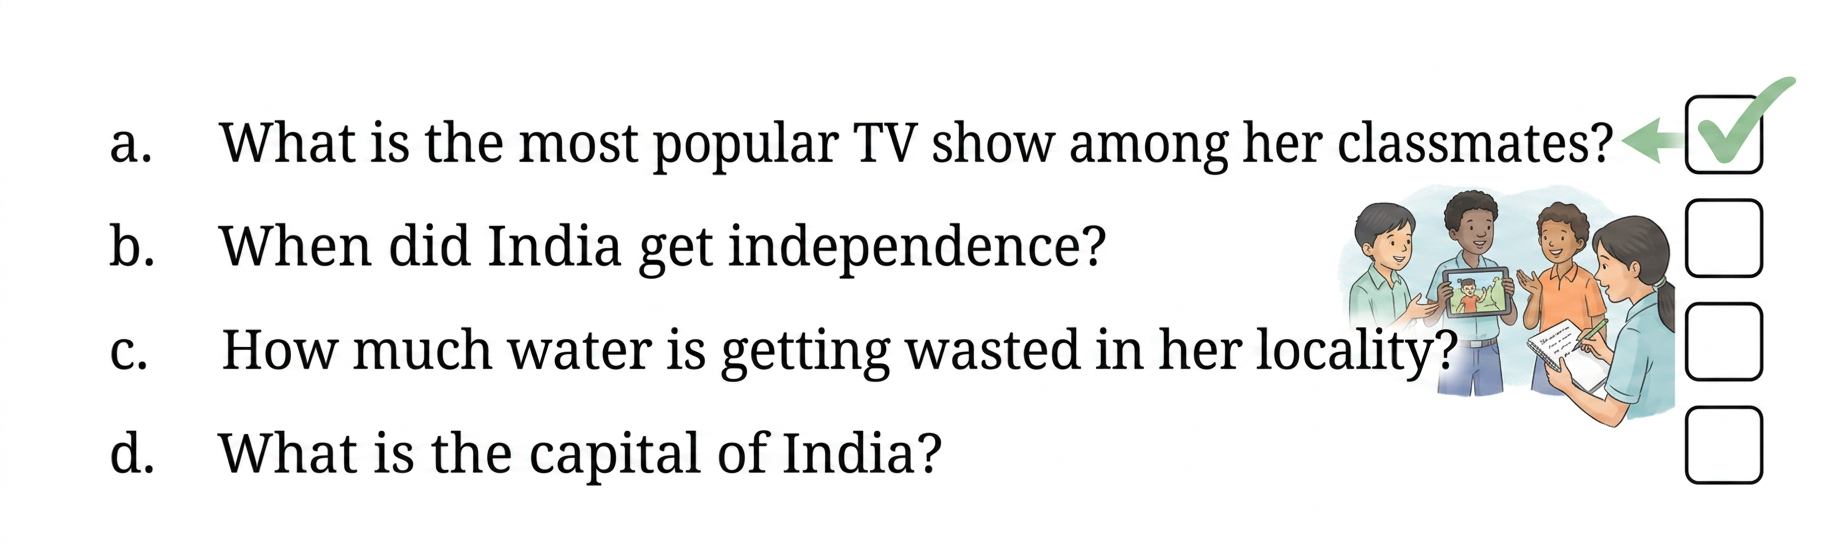
c. ✓ (Tick)
d. What is the capital of India?
Step 1 · Analyze capital city question
The capital of India is a well-known, fixed geographic fact (New Delhi) that is readily available in reference materials.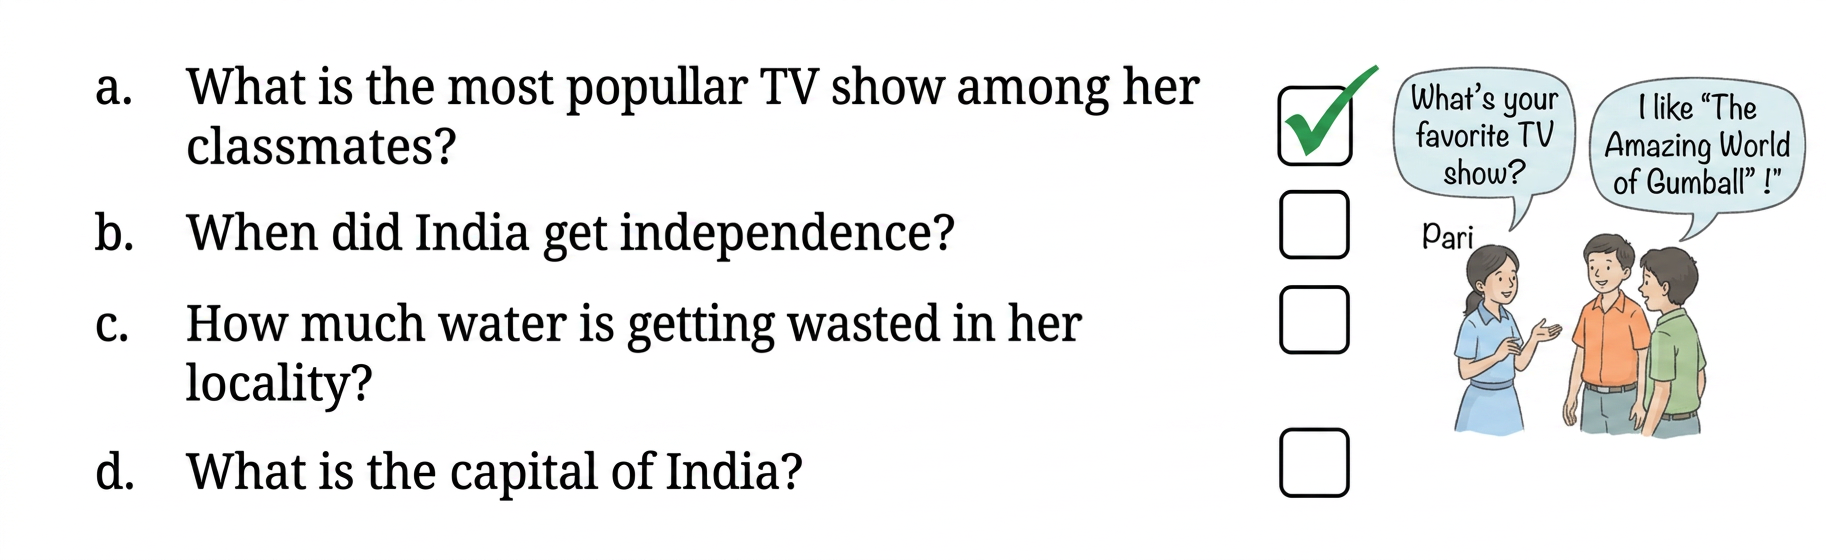
d. ✗ (Cross)
- Confusing Looking Up Facts with Data Collection: Looking up an already established fact in a book or on the internet is not data collection; data collection refers to gathering new primary information via surveys or direct observations.
- Assuming Classmate Preferences are Fixed Facts: Individual preferences vary and change, so they always require surveying to collect data.
More questions in FIO
What would you do to find the most popular game among Naresh’s and Navya’s classmates?
What is the most popular game in their class?
Try to find the most popular game among your classmates.
Pari wants to respond to the questions given below. Put a tick (✓) for the questions where she needs to carry out data collection and put a cross (✗) for the questions where she doesn’t need to collect data. Discuss your answers in the classroom.
a. What is the most popular TV show among her classmates? b. When did India get independence? c. How much water is getting wasted in her locality? d. What is the capital of India?
Complete the table to help Shri Nilesh to purchase the correct numbers of sweets:
a. How many students chose jalebi?
b. Barfi was chosen by students?
c. How many students chose gujiya?
d. Rasgulla was chosen by students?
e. How many students chose gulab jamun?
Is the above table sufficient to distribute each type of sweet to the correct student? Explain. If it is not sufficient, what is the alternative?
Help her to figure out the following:
a. The largest shoe size in the class is _______.
b. The smallest shoe size in the class is _______.
c. There are _______ students who wear shoe size 5.
d. There are _______ students who wear shoe sizes larger than 4.
How did arranging the data in ascending order help to answer these questions?
Are there other ways to arrange the data?
The following pictograph shows the number of books borrowed by students, in a week, from the library of Middle School, Ginnori:
(a) On which day were the minimum number of books borrowed?
(b) What was the total number of books borrowed during the week?
(c) On which day were the maximum number of books borrowed? What may be the possible reason?
Magan Bhai sells kites at Jamnagar. Six shopkeepers from nearby villages come to purchase kites from him. The number of kites he sold to these six shopkeepers are given below —
Prepare a pictograph using the symbol to represent kites. Answer the following questions:
a. How many symbols represent the kites that Rani purchased?
b. Who purchased the maximum number of kites?
c. Who purchased more kites, Jasmeet or Chaman?
d. Rukhsana says Poonam Ben purchased more than double the number of kites that Rani purchased. Is she correct? Why?
How many total cars passed through the crossing between 6 a.m. and noon?
Why do you think so little traffic occurred during the hour of 6–7 a.m., as compared to the other hours from 7 a.m.–noon?
Why do you think the traffic was the heaviest between 7–8 a.m.?
Why do you think the traffic was lesser and lesser each hour after 8 a.m. all the way until noon?
Samantha visited a tea garden, and collected data of the insects and critters she saw there. Here is the data she collected:
Help her prepare a bar graph representing this data.
Pooja collected data on the number of tickets sold at the Bhopal railway station for a few different cities of Madhya Pradesh over a two-hour period.
She used this data and prepared a bar graph on the board to discuss the data with her students, but someone erased a portion of the graph.
a. Write the number of tickets sold for Vidisha above the bar. b. Write the number of tickets sold for Jabalpur above the bar. c. The bar for Vidisha is 6 unit lengths and the bar for Jabalpur is 5 unit lengths. What is the scale for this graph? d. Draw the correct bar for Sagar. e. Add the scale of the bar graph by placing the correct numbers on the vertical axis. f. Are the bars for Seoni and Indore correct in this graph? If not, draw the correct bar(s).
Chinu listed the various means of transport that passed across the road in front of his house from 9 a.m. to 10 a.m.:
a. Prepare a frequency distribution table for the data. b. Which means of transport was used the most? c. If you were there to collect this data, how could you do it? Write the steps or process.
Roll a die 30 times and record the number you obtain each time. Prepare a frequency distribution table using tally marks. Find the number that appeared:
a. The minimum number of times.
b. The maximum number of times.
c. Find numbers that appeared an equal number of times.
Faiz prepared a frequency distribution table of data on the number of wickets taken by Jaspreet Bumrah in his last 30 matches:
a. What information is this table giving? b. What may be the title of this table? c. What caught your attention in this table? d. In how many matches has Bumrah taken 4 wickets? e. Mayank says, "If we want to know the total number of wickets he has taken in his last 30 matches, we have to add the numbers , up to ." Can Mayank get the total number of wickets taken in this way? Why? f. How would you correctly figure out the total number of wickets taken by Bumrah in his last 30 matches, using this table?
Mudhol Hounds (a type of breed of Indian dogs) are largely found in North Karnataka’s Bagalkote and Vijaypura districts. The government took an initiative to protect this breed by providing support to those who adopted these dogs. Due to this initiative, the number of these dogs increased. The number of Mudhol dogs in six villages of Karnataka are as follows—
Village A : 18, Village B : 36, Village C : 12, Village D : 48, Village E : 18, Village F : 24
Prepare a pictograph and answer the following questions:
a. What will be a useful scale or key to draw this pictograph?
b. How many symbols will you use to represent the dogs in Village B?
c. Kamini said that the number of these dogs in Village B and Village D together will be more than the number of these dogs in the other 4 villages. Is she right? Give reasons for your response.
A survey of 120 school students was conducted to find out which activity they preferred to do in their free time:
Draw a bar graph to illustrate the above data taking the scale of . Which activity is preferred by most students other than playing?
Students and teachers of a primary school decided to plant tree saplings in the school campus and in the surrounding village during the first week of July. Details of the saplings they planted are as follows—
a. The total number of saplings planted on Wednesday and Thursday is _________.
b. The total number of saplings planted during the whole week is _________.
c. The greatest number of saplings were planted on _________ and the least number of saplings were planted on _________.
Why do you think that is the case? Why were more saplings planted on certain days of the week and less on others? Can you think of possible explanations or reasons? How could you try and figure out whether your explanations are correct?
The number of tigers in India went down drastically between 1900 and 1970. Project Tiger was launched in 1973 to track and protect the tigers in India. Starting in 2006, the exact number of tigers in India was tracked. Shagufta and Divya looked up information about the number of tigers in India between 2006 and 2022 in four-year intervals. They prepared a frequency table for this data and a bar graph to present this data, but there are a few mistakes in the graph. Can you find those mistakes and fix them?
If you wanted to visually represent the data of the heights of the tallest persons in each class in your school, would you use a graph with vertical bars or horizontal bars? Why?
If you were making a table of the longest rivers on each continent and their lengths, would you prefer to use a bar graph with vertical bars or with horizontal bars? Why? Try finding out this information, and then make the corresponding table and bar graph! Which continents have the longest rivers?