Question 1
- The graphs of are given in Fig. 2.10 below, for some polynomials . Find the number of zeroes of , in each case.
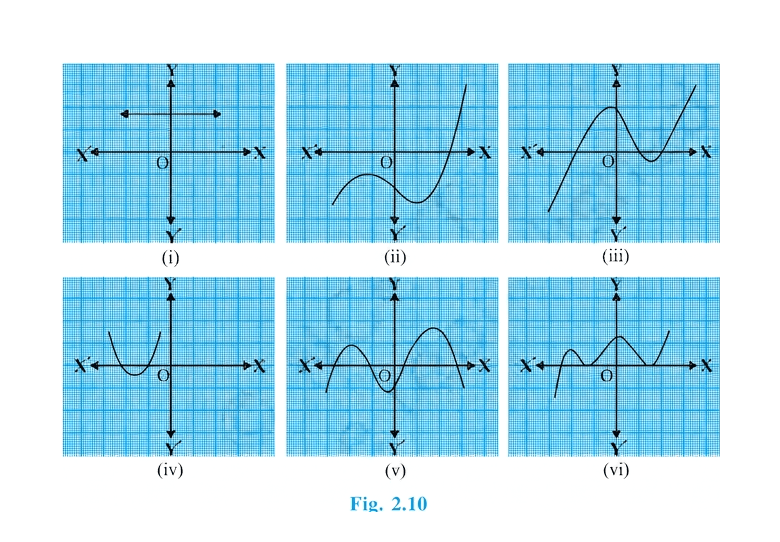
- For any polynomial , the zeroes are the -coordinates of the points where the graph intersects or touches the -axis (i.e., where ).
- Therefore, the number of zeroes of is simply the number of times the graph intersects or touches the -axis.
(i) Find the number of zeroes of for graph (i).
Step 1 · Analyze Graph (i)
The graph is a straight line parallel to the -axis and does not intersect or touch the -axis at any point.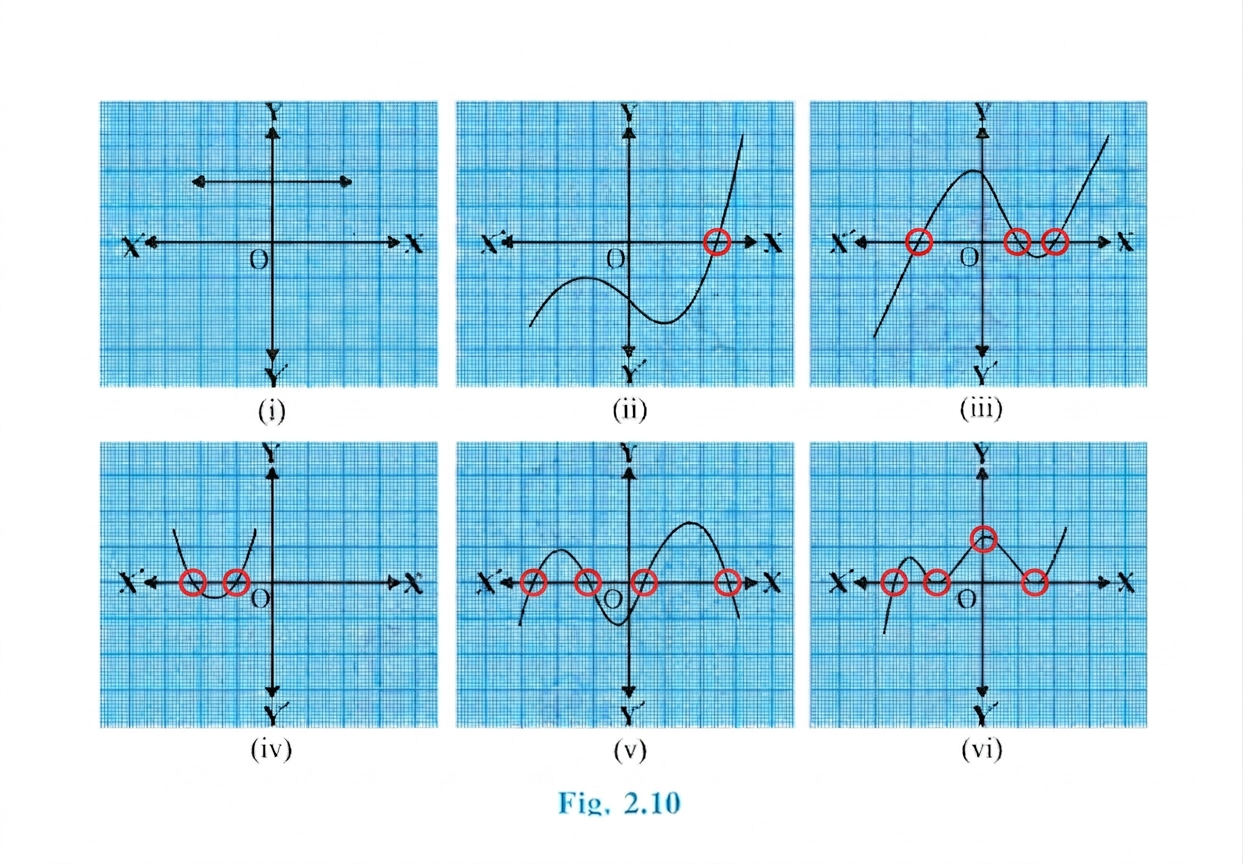
(i)
(ii) Find the number of zeroes of for graph (ii).
Step 1 · Analyze Graph (ii)
The graph intersects the -axis at distinct points.
(ii)
(iii) Find the number of zeroes of for graph (iii).
Step 1 · Analyze Graph (iii)
The graph intersects the -axis at only point.
(iii)
(iv) Find the number of zeroes of for graph (iv).
Step 1 · Analyze Graph (iv)
The graph is a parabola that intersects the -axis at distinct points.
(iv)
(v) Find the number of zeroes of for graph (v).
Step 1 · Analyze Graph (v)
The graph intersects the -axis at distinct points.
(v)
(vi) Find the number of zeroes of for graph (vi).
Step 1 · Analyze Graph (vi)
The graph touches/intersects the -axis at distinct points.
(vi)
- Counting -axis Intercepts: Mistakenly counting points where the graph crosses the -axis. Zeroes of correspond strictly to intersections with the -axis ().
- Ignoring Points of Contact: Forgetting that a point where the graph just touches the -axis (without crossing) still counts as a zero.